
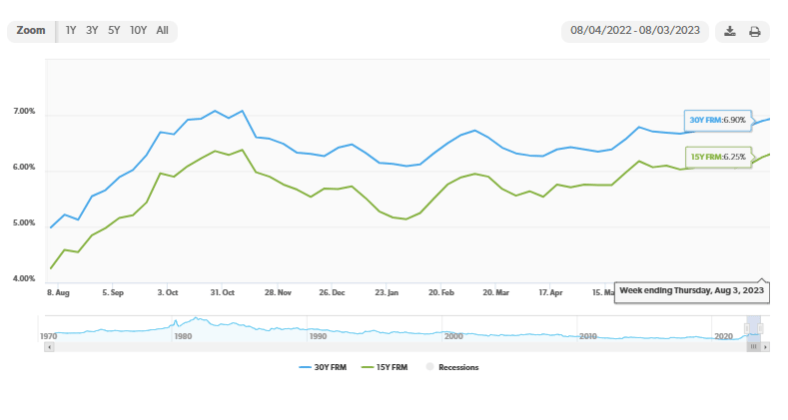
Primary Mortgage Market Survey® U.S. weekly averages as of August 17, 2023
Last week saw a dip in both stock and bond markets, driven by positive economic news. This could lead to the Federal Reserve maintaining higher interest rates for an extended period. Though it dropped below 4.3 percent, the 10-year U.S. Treasury yield marked its fifth consecutive week of rising rates, showing the unpredictable nature of rate predictions.
This week: Federal Reserve Chair Powell will speak at the end of the week, while in Jackson Hole at the annual symposium. He will likely highlight progress in curbing inflation, while emphasizing the importance of remaining vigilant to current economic conditions–leaving room for more rate hikes. He’s expected to reiterate the Fed’s commitment to maintaining a 2 percent inflation target and addressing the market’s projected rate hikes for the upcoming year.
As the Federal Reserve focuses on stabilizing prices and employment, mortgage rates in the U.S. have surged to a 20-year high, affecting home sales and refinancing. Nevertheless, potential home buyers are still active, particularly in the new home market. Builders are offering incentives to move inventory despite the elevated mortgage rates. Building permits for new homes also saw an increase in July.
Concerns over data from China, coupled with a more hawkish stance from Fed officials, have prompted a reassessment of the economic landscape. This contributed to recent turmoil in the Treasury bond market, pushing 10-year yields close to their highest levels since 2007. The delayed impact of monetary policy on the economy, among other factors, has sparked a debate on the current risks in the bond market.
Misjudging the timing of interest rate hikes could lead to persistently high rates, potentially resulting in a more significant economic decline and inflation than expected. The futures market suggests that the first rate cut might not occur until 2024. The Fed’s July meeting minutes highlighted the ongoing risks of inflation, indicating the need for further tightening. The messaging itself could be just as important as any actions, as interest rate markets adjust to an extended period of higher rates.
Bottom line: The rising yields are raising concerns among investors due to past experiences where such increases caused disruptions in the market. Although the 10-year yield remains below the Fed’s short-term rates, some experts anticipate further rate hikes. Bond yields continued their upward trend, with the recent Federal Open Market Committee (FOMC) minutes hinting at potential additional rate hikes. While investors are assessing how rising yields might affect stock values, the housing market could experience more immediate impacts. 30-year fixed-rate mortgages have crossed the 7 percent mark due to recent developments, reaching their highest point in over two decades.

Week of August 14, 2023 in Review
Despite ongoing challenges facing home builders, construction activity picked up last month. Plus, the minutes from the Fed’s July meeting provided some hints about what’s next for rate hikes. Here are the latest headlines:
- Strong Summer for Housing Starts
- Understanding the Decline in Home Builder Confidence
- Are More Fed Rate Hikes Ahead?
- Initial Jobless Claims Remain Tame
- What an Important Recession Indicator Is Saying
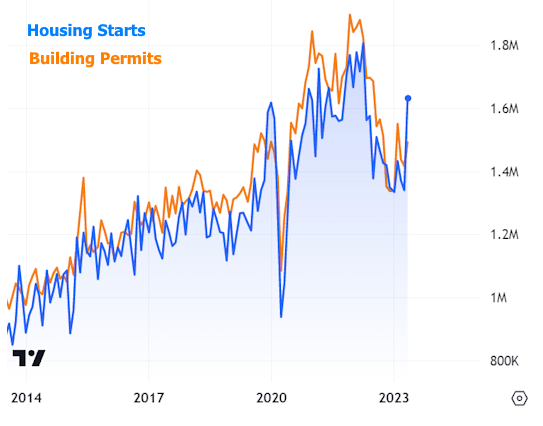
Strong Summer for Housing Starts

Home construction picked up in July as Housing Starts, which measure the start of construction on homes, were up 3.9% from June. Starts for single-family homes also saw improvement, as they were 6.7% higher from June to July. Building Permits, which are indicative of future supply, were relatively flat last month. Permits for single-family homes rose 0.6% from June to the highest level in a year.
What’s the bottom line? The last three months have brought the highest number of Housing Starts so far this year. While this is a step in the right direction, more inventory is needed to meet demand.
When we look at new supply that will be coming to market (around 1.45 million homes annualized per the latest Housing Starts total) and subtract roughly 100,000 homes that need to be replaced every year due to aging, we’re well below demand as measured by household formations that are trending at 2.07 million. Even looking at future supply (Building Permits at 1.44 million annualized), we’re still lower than where we need to be.
This ongoing disparity between supply and demand is a key reason why home values continue to rise and why now provides great opportunities to take advantage of appreciation gains.
Understanding the Decline in Home Builder Confidence

The National Association of Home Builders (NAHB) Housing Market Index, which measures builder confidence, fell six points to 50 in August. However, this latest reading follows seven consecutive monthly increases and confidence remains right at the breakeven level between expansion and contraction.
What’s the bottom line? The NAHB cited several reasons for the decline in sentiment this month, including rising mortgage rates, high construction costs stemming from a lack of workers, a shortage of buildable lots, and ongoing shortages of distribution transformers (which are crucial for converting voltage in transformer lines to appropriate household levels). Record high heat may have also deterred some potential buyers from home shopping, thereby impacting builders’ perception of buyer traffic.
Are More Fed Rate Hikes Ahead?
The minutes from the Fed’s July meeting showed that the Fed no longer believes that our economy will enter a recession, but they do see downside risks to growth. The Fed also believes there are upside risks to inflation, as the minutes showed they are not yet sure they have won the battle on inflation and more rate hikes may be ahead.
What’s the bottom line? Remember, the Fed has been hiking its benchmark Fed Funds Rate (which is the overnight borrowing rate for banks) to try to slow the economy and curb inflation. July’s hike of 25 basis points was their eleventh since March of last year.
All eyes are now turned to September 20, which is when the Fed’s next rate decision will be announced. Inflation, labor sector and other economic data released in the coming weeks will play a key role in this decision. The minutes did show that the Fed feels the labor market needs a “balancing of demand and supply.” In other words, they may want to see weaker headline job figures before calling it quits on rate hikes.
Initial Jobless Claims Remain Tame

One area of the labor sector still not showing sustained weakness is unemployment claims. The number of first-time filers fell by 11,000, with 239,000 Initial Jobless Claims reported in the latest week. Initial Claims have remained relatively tame after topping 260,000 for the first three weeks of June. which suggests that employers are trying to retain their workers. This trend coincides with recent reporting that many businesses are struggling to find qualified workers for their positions.
Meanwhile, Continuing Claims rose by 32,000, with 1.716 million people still receiving benefits after filing their initial claim. This number has been trending lower since topping 1.861 million in early April, reflecting a mix of people finding new jobs and benefits expiring.
What’s the bottom line? With the Fed focused on employment data, this was an important real-time report because it includes the sample week that the Bureau of Labor Statistics will use in the modeling for their job growth estimates. Again, the Fed will be closely analyzing this headline job growth figure when August’s Jobs Report is released on September 1.
What an Important Recession Indicator Is Saying
The Conference Board reported that Leading Economic Indicators (LEI) fell 0.4% in July, which is the sixteenth consecutive month of declines. The LEI tracks where the economy is heading, and it “continues to suggest that economic activity is likely to decelerate and descend into mild contraction in the months ahead,” explained Justyna Zabinska-La Monica, Senior Manager, Business Cycle Indicators.
What’s the bottom line? Despite the Fed’s belief that we can avoid a recession, the Conference Board is standing by their forecast that our economy will enter “a short and shallow recession in the Q4 2023 to Q1 2024 timespan.” Yield curve inversions, near record high credit card debt, and the lag effect of the Fed’s rate hikes are additional reasons why a recession may not be off the table just yet.
While a recession is not a great thing for the economy, one positive aspect is that periods of recession are always coupled with lower interest rates.
What to Look for This Week
More housing data is ahead, as July’s Existing and New Home Sales will be reported on Tuesday and Wednesday, respectively. Look for the latest Jobless Claims figures as usual on Thursday.
Investors will also be watching closely as economists, central bankers and policy makers from around the world join the Fed for its Jackson Hole Economic Symposium, which starts on Thursday.
Technical Picture
Mortgage Bonds ended last week trading in a range with support at 97.563 and resistance at 97.984. The 10-year remains below the 4.33% ceiling, which is the high from October and a very important technical level. Yields ended last week around 4.25% and are also overdue for some relief.


-8-10-2023.png?w=788&ssl=1)


-7-20-2023.png?w=788&ssl=1)
-7-19-2023.png?w=788&ssl=1)
-7-19-2023.png?w=788&ssl=1)
-7-20-2023.png?w=788&ssl=1)

-7-13-2023.png?w=788&ssl=1)

-7-7-2023.png?w=788&ssl=1)
-7-6-2023.png?w=788&ssl=1)
-7-6-2023.png?w=788&ssl=1)

-6-29-2023.png?w=788&ssl=1)

-6-27-2023.png?w=788&ssl=1)
-6-29-2023.png?w=788&ssl=1)

-6-22-2023.png?w=788&ssl=1)
-6-20-2023.png?w=788&ssl=1)
-6-22-2023.png?w=788&ssl=1)


-6-15-2023.png?w=788&ssl=1)